Module
CRM Card Highlighting
The module enables color highlighting of CRM entity cards — leads, contacts, deals, companies, and smart processes — across all available views: list, pipelines (Kanban), tasks, and calendar.
15,000 ₽
↗Аккаунт в General iT
Войдите или создайте аккаунт для управления услугами в панели.
MODULE FOR 1C-BITRIX
lion
The Website Click Analytics module is designed to evaluate interface usability, identify the most active elements, and detect areas that users mistakenly perceive as links. Click activity is visualized on a heatmap using a color gradient that reflects interaction frequency. The tool collects data on user clicks, page transition counts, and time spent on the site.
The Website Click Analytics module is designed to evaluate interface usability, identify the most active elements, and detect areas that users mistakenly perceive as links. Click activity is visualized on a heatmap using a color gradient that reflects interaction frequency.
The tool collects data on user clicks, page transition counts, and time spent on the site. Statistics are gathered exclusively within the public section of the portal. Based on this data, click heatmaps and page visit graphs are generated.
For sites licensed with 'Bitrix: Site Management', the heatmap is built using data from all users. The visualization is implemented using the heatmapjs library.
The module analyzes clicks on sites with a Bitrix24 license using data from selected users. For department heads, a feature is implemented to view click heatmaps generated from the activity of employees within their department, as well as employees and managers of subordinate departments.
Building a click heatmap
On sites with a Bitrix Site Management license, to generate the report, navigate to the required page and click the 'Analytics' button.

Fig. 1. Analytics button.
Clicking this button opens the Filter Settings dialog box shown in the figure below.
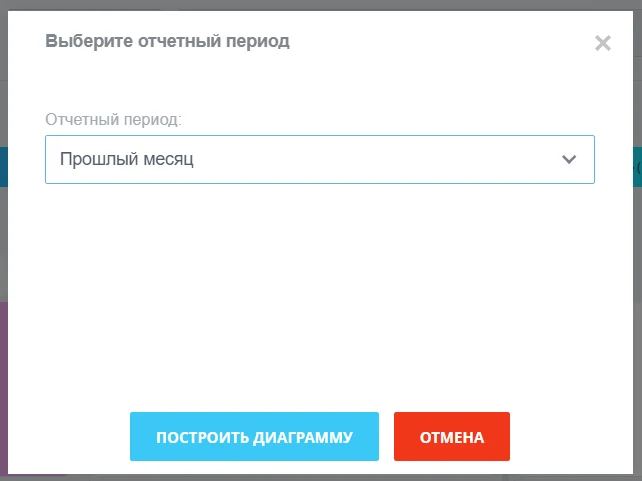
The reporting period for the click heat map is configured in the 'Filter Settings' dialog box. The following time ranges are available:
'This month' — data from the current month (default).
'Last month' — data from the previous month.
'This week' — data from the current week.
'Last week' — data from the previous week.
'Last 7 days' — data from the past 7 days.
'After' — data obtained after a specified date. Selecting this option displays an input field with a calendar for date selection.
'Before' — data obtained before a specified date. Selecting this option displays an input field with a calendar for date selection.
'Interval' — data within a range between two selected dates. Selecting this option displays two input fields for specifying the start and end dates, with calendar selection available for both.
'All time' — data from the entire period of statistics collection.
3. Click the Build button.
The Filter Settings dialog will close, and the click heatmap will display with the applied filter parameters. The background color and its transparency are configured in the module settings. An example of the click heatmap displayed on one of the site pages is shown in the figure below.
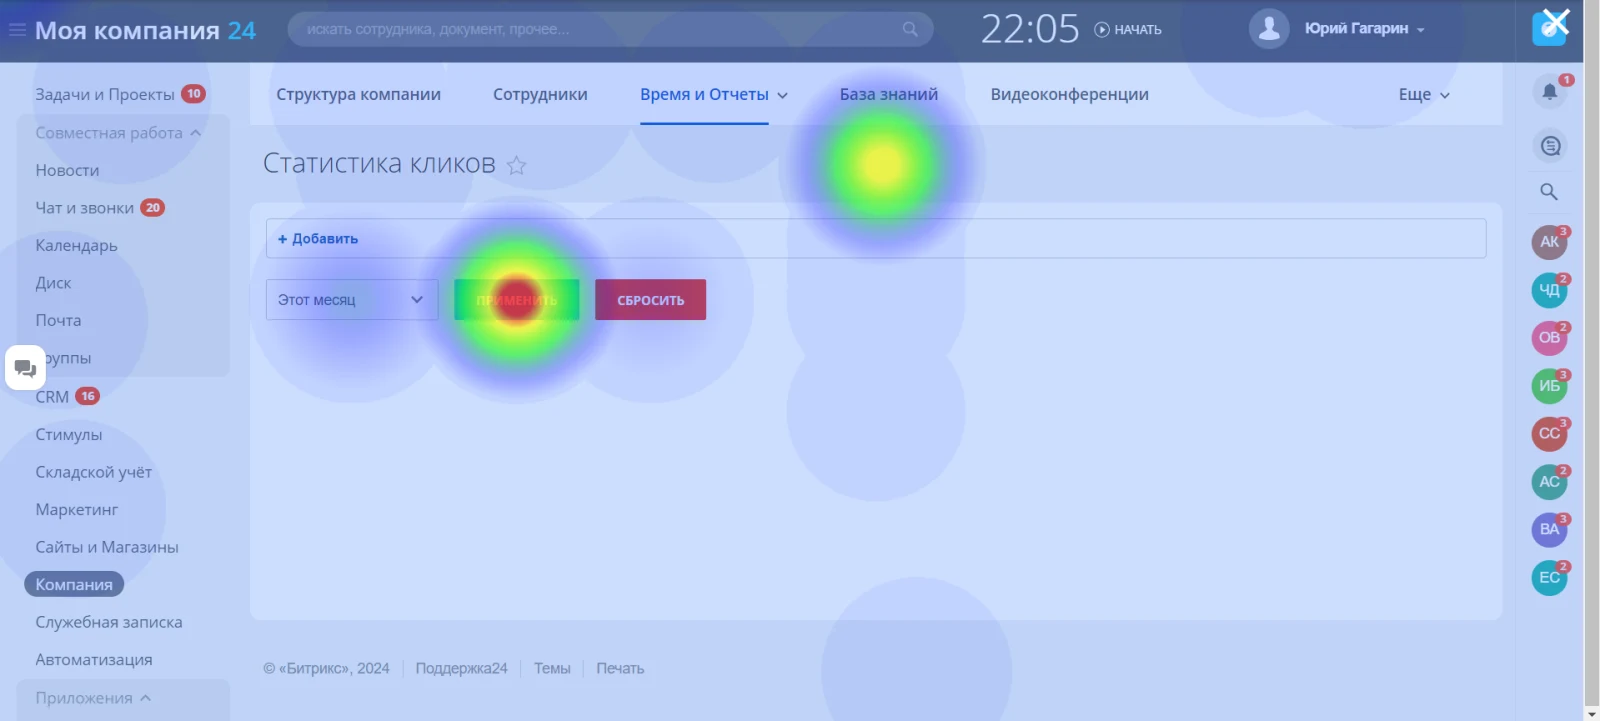
Figure 3 shows an example of a click heat map displayed on a website page.
For sites with a Bitrix24 license, perform the following steps:
1. Click the button displaying your first and last name on the required page. This action will open the user menu, as shown in the illustration below.

Figure 4 shows the Analytics button in the user menu. Clicking this button opens the Display Settings dialog box.
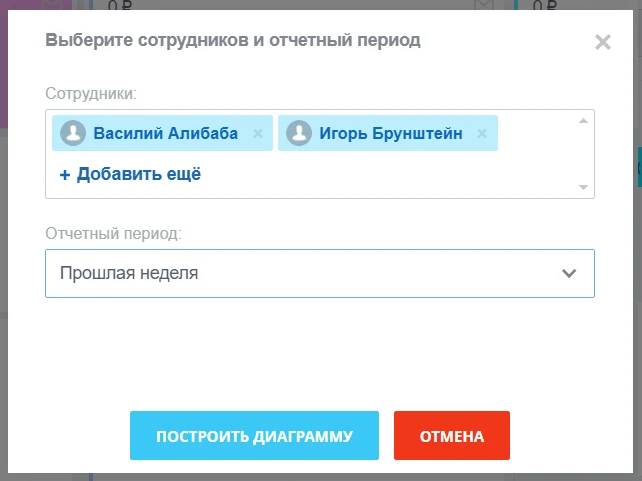
Fig. 5. Display Settings dialog
3. Select users (a click map will be generated based on the click statistics of the selected users), specify the time range, and click the Build button. The Filter Settings dialog will close, and a click heat map reflecting the applied filter parameters will be displayed (see Fig. 3).
To exit the click heat map view, click anywhere on the page in the browser.
Page Visit Statistics
Page visit statistics can be used for designing new website pages and analyzing user patterns.
Depending on the website license, charts of page visits generated using the AmCharts library are available at the following locations:
For Bitrix Site Manager: in the administrative section of the portal, navigate to Services → Click Analytics → Page Visit Statistics.
For Bitrix24: in the public section of the site under the Company tab. To access the statistics page, go to Company → Time and Reports → Click Statistics.
On the module pages, a search bar allows filtering users for statistics generation, accompanied by a reporting period field and 'Build' and 'Reset' buttons. Available reporting periods include: 'This Month' (data from the current month, default), 'Last Month' (data from the previous month), 'This Week' (data from the current week), 'Last Week' (data from the previous week), and 'Last 7 Days' (data from the past week). For 'After' and 'Before' options, a date input field with a calendar picker appears below the selection list.
Period selection: The «Interval» option filters data within a specified date range. Selecting this value reveals input fields for dates below the list; attempting to enter a date opens a calendar picker. The «All time» option displays statistics accumulated since tracking began.
Clicking the «Build» button displays information graphically, including the number of transitions to specific site URLs.
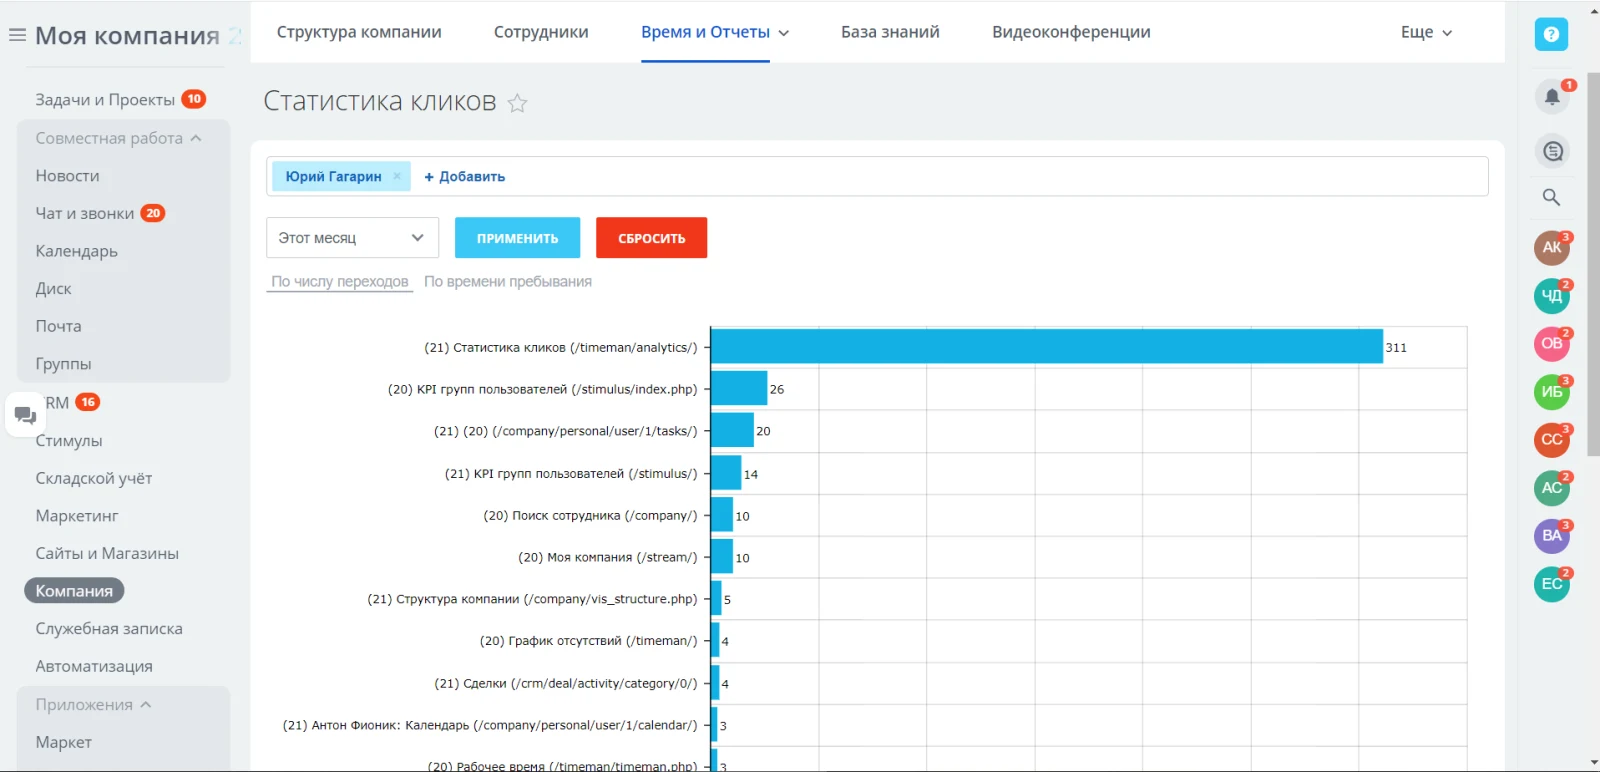
Figure 6 illustrates a graphical representation of statistics on transitions to specific site URLs, along with data on the time spent by users on individual pages.
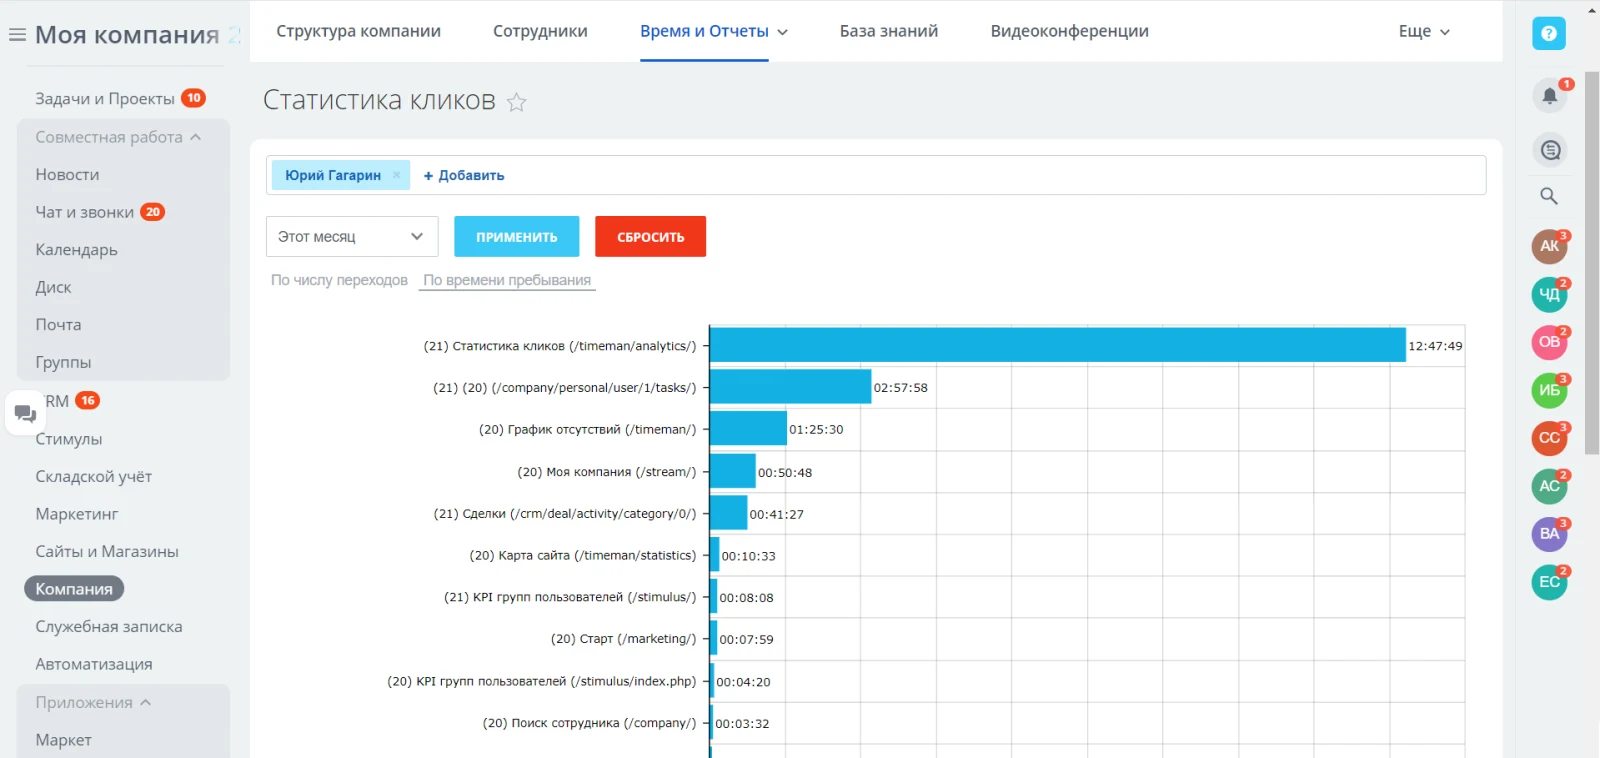
Figure 7. Example of graphical display of time spent by users on specific website pages.
Clicking the Reset button performs the following actions: the user search string is cleared, the Report Period field is set to This Month, and all charts on the page are removed.
Data Storage
1,000 records regarding a click on a page element or a page visit occupy approximately 120 KB. Depending on user interaction intensity, 1,000 clicks are accumulated in an average of 2 hours of intensive work, while 1,000 page views take an average of 8 hours. With a large number of concurrent users, there is a risk of quickly exhausting free disk space on the site server. Therefore, it is recommended to use this module as a periodic tool and store user click and page visit information in a remote database.
General iT can connect “Website Click Analytics”, configure it and verify the integration with the existing website.
UPDATE HISTORY
Fixed an error in selecting a user for the subsequent deletion of statistics data for sites under the Bitrix Site Management license in the 'Delete Parameter Settings' dialog box on the 'Administration' page in the portal's administrative section.
USER EXPERIENCE
How does this solution work in a real project? Share your experience and help others choose.
There are no reviews of this solution on git.ru yet. Tell us what worked well and what could be improved.
Verified purchaseAdd a key if you wish. A verified review gets a badge, priority placement and more rating weight.
Open to every clientJust sign in to your account. A key is optional; all reviews are moderated.
YOUR PROJECT INFRASTRUCTURE
FROM THE SAME DEVELOPER
lion
The module enables color highlighting of CRM entity cards — leads, contacts, deals, companies, and smart processes — across all available views: list, pipelines (Kanban), tasks, and calendar.

The module enables automatic sending of messages generated by a business process robot to Viber users. It serves as an alternative notification channel, allowing instant alerts about changes to leads, deals, and smart processes.

The solution allows sending messages generated in a business process to a Telegram user via a bot. It serves as an alternative notification channel, enabling instant delivery of messages regarding changes to leads, deals, and smart processes. The 'Telegram Message' activity is located in the 'Notifications' block of the business process generator.
MORE FOR YOUR WEBSITE

This module automatically optimizes images and converts them to WebP or AVIF formats for browsers that support these standards. Processing is performed locally without relying on external services. This approach helps improve site performance and aligns with SEO best practices.

The SMSBiz module is designed for sending SMS notifications in online stores and corporate portals built on the 1C-Bitrix platform. Installation and use do not require programming skills and take only a few minutes. The solution is based on the SMSInt service, which has been operating in the market for over 15 years.

The module allows you to quickly add a New Year atmosphere to your website. The package includes falling snow effects and interactive Christmas ornaments positioned at the top of the page.
BEFORE YOU ORDER